

In the first part of this series of articles I covered the most common issue affecting mid-market leaders, holding them back from success. This article continues diving deeper into how we (and you can) quantified, identified and measured the size of our issues. This whole series is also available as a download.

How we manually quantified (and so can you) your strategic drift
As the year closed out, I decided I wanted to see, to measure, to quantify; just how far things had drifted from that original intent, that agreed scope; that direction the leadership team had created so much enthusiasm, passion and drive around. I wanted to do this with near to perfect, 20/20 hind-sight; knowing what the outcomes were, what had been delivered, what had been discarded and left on the workshop floor, what had been spent and how long it had taken.
What the business expected we'd find |
I grabbed a few key members in my department into a meeting room, explaining the process the leadership team goes through in their planning session, that I wanted them to have the same exposure and experience to the process, through our own little workshop. The only difference was perspective. I wanted to know if this highly valuable tool would work from the perspective of the team’s work, applying it across the sub-projects, tasks and sub-tasks that had been part of the deliverables in question.
Before I convened this council, I had looked for suitable tools that could help with this type of analysis. I wasn't overly surprised when I couldn't find anything that would easily work for us. The leadership team obviously hadn't either, as we'd used a whiteboard after-all; and the quantity of items to assess and review was much larger. So, I did what we all do... I resigned myself to using Excel.
I grabbed a few key members in my department into a meeting room, explaining the process the leadership team goes through in their planning session, that I wanted them to have the same exposure and experience to the process, through our own little workshop. The only difference was perspective. I wanted to know if this highly valuable tool would work from the perspective of the team’s work, applying it across the sub-projects, tasks and sub-tasks that had been part of the deliverables in question.
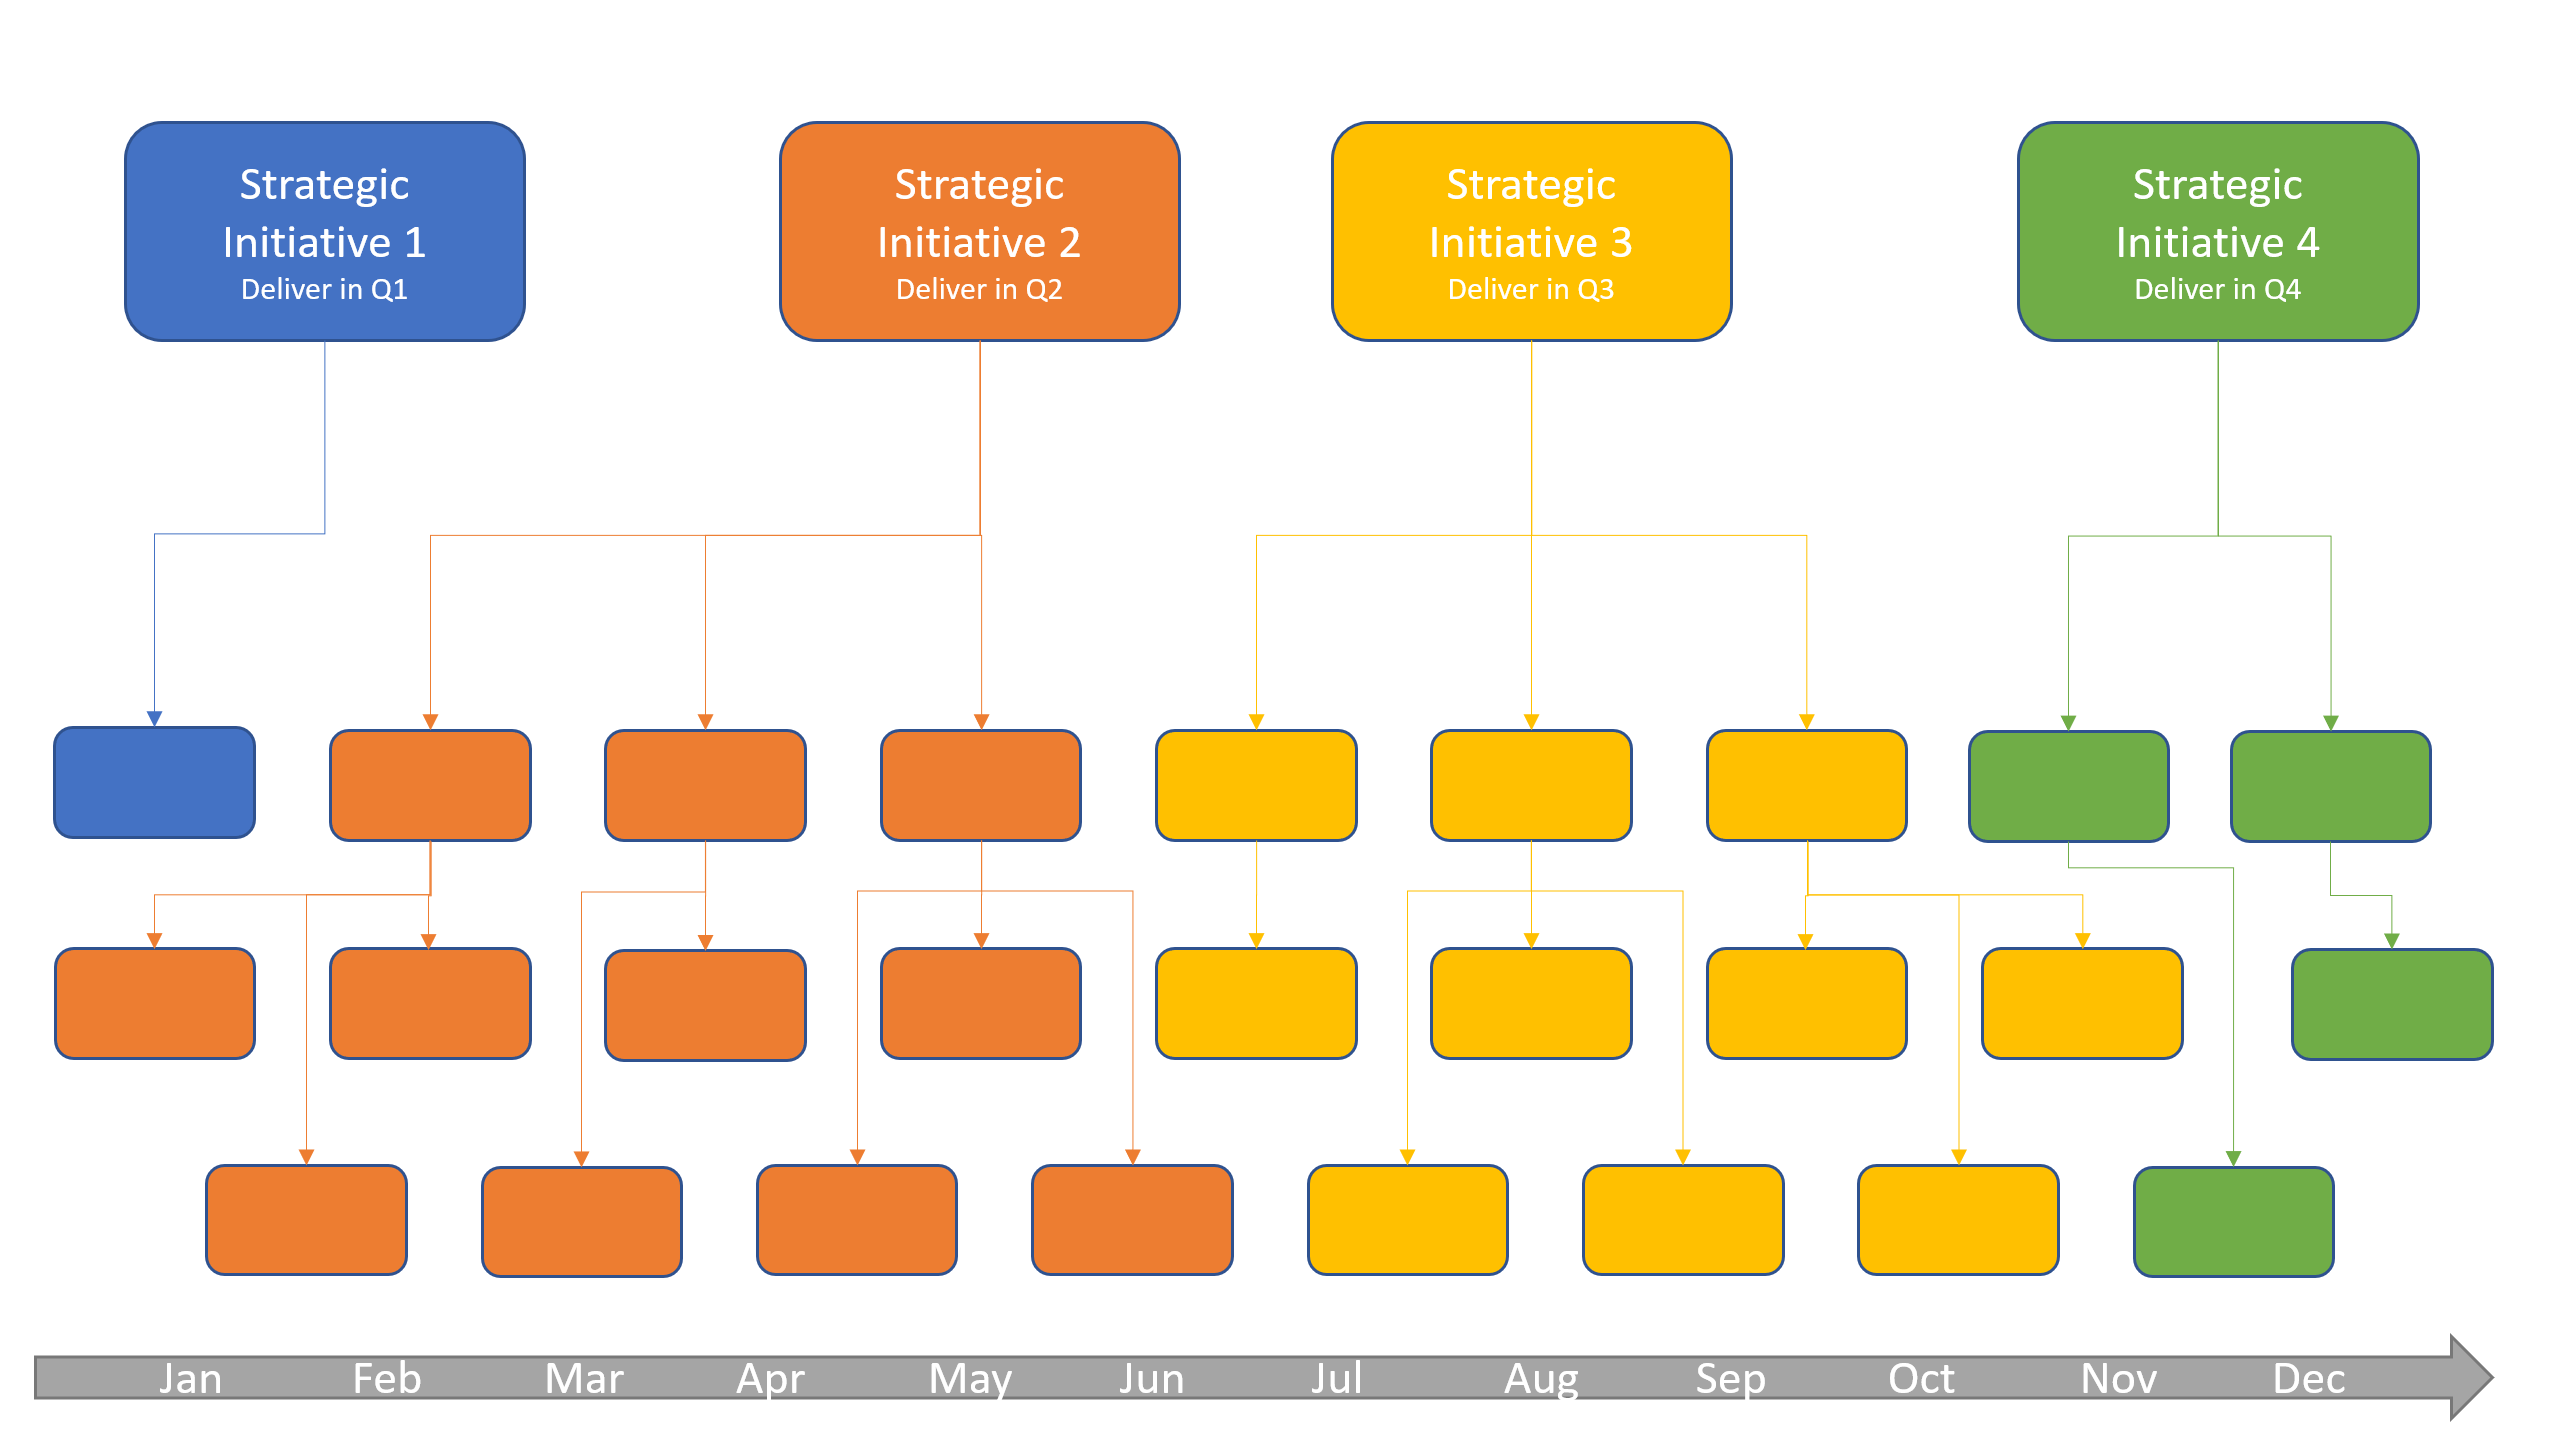
I exported what I could from the various tools, software and platforms the business used; collated them into an almighty Excel spreadsheet. One item per row, the next few columns, each representing the separate key driving factors from the leadership’s strategy session... those big colored boxes.
|
Sub-Project/Task |
Factor |
Factor |
Factor |
Factor |
Factor |
|
|
|
|
|
|
|
|
Sub Project 1 |
✔️ | ✔️ | |||
|
|
|||||
|
Sub Project 1 / Task 1 |
✔️ | ✔️ | ✔️ | ||
|
|
|
|
|
|
|
|
Sub Project 1 / Task 2 |
✔️ | ✔️ | |||
|
… |
|
|
|
|
|
|
Sub Project 2 |
✔️ | ✔️ | |||
|
|
|
|
|
|
|
|
Sub Project 2 / Task 1 |
✔️ | ||||
|
|
|
|
|
|
|
|
Sub Project 2 / Task 2 |
✔️ | ||||
|
… |
|
|
|
|
|
Even though we had an entire year's worth of work to go over, it wasn't as big an exercise as we first thought it was going to be. We did have a few rough starts as we assessed the first few items, but we got into a pretty quick rhythm and flow, progressing our way down the spreadsheet; assessing each task to the key driving factors, marking each aligned factor the task had.
What I had suspected and what we actually found |
It took us a few days, but eventually we reached the end of the spreadsheet. The oldest tasks certainty took longer, as some rationale for decisions were lost to time (so be prepared for this), but we also got pretty proficient and faster as we reached the end.
Finally, I had the data I wanted. I had a clear view of what we had done as a department and what we had originally started out with as an aspirational plan. More importantly thought, I had an ability to compare the two. A few Excel pivots and charts later, I essentially had a report for the leadership team. That report shocked not just me, but the rest of the leadership team. The department had a list of issues.
The next article in this series covers how we approached and presented the situation back to the leadership team and how the business responded.